

Imagine logging into your support dashboard on a busy Tuesday morning.
You see that your team handled 650 live chats over the past week. On paper, the queue is clear, the widget is active, and conversations are flowing.
But what actually happened inside those 650 conversations?
How long did high-intent buyers wait before an agent said hello? How many customers got stuck in a queue and closed the tab in frustration? Did your automated bot actually solve inquiries, or did it trap users in endless loops until they gave up?
Simply installing a widget and watching conversation counts climb isn’t analytics.
Every interaction captures data points on speed, resolution quality, customer sentiment, agent workload, revenue attribution, and automation efficiency with Customer Support Automation.
Live chat analytics is the process of translating that raw conversational data into actionable business decisions. Today, we are going to discuss the 12 most critical live chat metrics, show you how to calculate them, and explain what actions to take when your numbers slip.
So without further ado, let’s read on.
What Is Live Chat Analytics?
Live chat analytics is the systematic collection, measurement, and interpretation of conversation data generated across your live chat channels.
Rather than viewing support as a black box, analytics provides granular visibility into:
- Operational Speed: How fast visitors connect with assistance.
- Resolution Quality: How effectively your team and automated systems solve issues.
- Customer Sentiment: How satisfied buyers feel throughout the interaction.
- Team Capacity & Utilization: How chat volume is distributed across your team.
- Friction Points: Where customers drop off or abandon purchases.
- Commercial Impact: How conversations influence pipeline, conversions, and sales.
Live Chat Metrics vs. Live Chat Analytics: What’s the Difference?
While these two terms are often used interchangeably, understanding the difference is essential for making sound operational decisions:
- A Metric is a single, isolated data point (e.g., First Response Time is 48 seconds).
- Analytics is the synthesis of multiple metrics, trends, and context over time to uncover the root cause behind that data.
For example, if your First Response Time spikes from 45 seconds to 3 minutes on Monday mornings, the metric alerts you to an operational bottleneck. Analytics reveals that 40% of your weekly chat volume arrives between 9:00 AM and 11:00 AM following weekend product updates,pointing directly to an agent scheduling and routing mismatch.
12 Live Chat Metrics Every Business Should Track
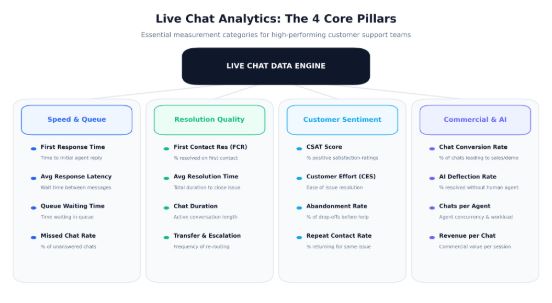
To build a high-performing support operation, you need a balanced scorecard across operational efficiency, customer satisfaction, agent productivity, and commercial impact.
1. First Response Time (FRT)
First Response Time (FRT) measures how many seconds or minutes elapse from the moment a visitor initiates a chat to the moment an agent (or assigned rep) delivers the initial reply.
When a customer opens a live chat widget, they expect immediate engagement. Unlike email, where a 4-hour turnaround is often acceptable, chat is built on real-time urgency. Industry data indicates that modern online shoppers expect live chat responses in under 60 seconds, with top-performing teams targeting 30 to 45 seconds.
Formula:
First Response Time = Timestamp of First Agent Reply – Timestamp of Customer’s Initial Message
Example:
A customer asks a question on your pricing page at 14:02:10 and an agent responds at 14:02:45. The FRT is 35 seconds.
What to do when FRT is high:
If your FRT routinely exceeds 90 seconds, examine queue sizes, audit concurrent chat limits, and implement smart chat routing to distribute incoming traffic evenly based on agent availability.
2. Average Response Time (Wait Time Between Replies)
While FRT tracks the initial handshake, Average Response Time measures the average duration a customer waits for replies throughout the entire conversation.
A fast first response is meaningless if an agent says “Hello!” in 15 seconds and then leaves the customer waiting 4 minutes between every subsequent troubleshooting step. Tracking subsequent message latency ensures the conversation maintains momentum.
Formula:
Average Response Time = Total Wait Time Across All Customer Messages in Chat / Total Number of Customer Messages
Example:
Over a 6-message conversation, a customer waits 30s, 45s, and 15s for agent replies. The Average Response Time is (30 + 45 + 15) / 3 = 30 seconds.
What to do when Average Response Time lags:
High mid-chat latency usually means agents are juggling too many complex chats simultaneously, or spending excessive time looking up documentation across disconnected internal systems. Provide ready-to-use response templates and unified customer profile sidebars to reduce lookup time.
3. First Contact Resolution Rate (FCR)
First Contact Resolution (FCR) measures the percentage of customer inquiries that are fully resolved during the initial session, without requiring follow-up tickets, email threads, or repeat visits.
FCR is widely regarded as the single most critical indicator of support quality. A lightning-fast 20-second chat that ends with “Let me check with engineering and email you tomorrow” represents a low-FCR experience.
High FCR demonstrates that your team has deep product knowledge, clear troubleshooting playbooks, and the operational authority to issue refunds, update accounts, or resolve errors immediately.
Formula:
FCR Rate (%) = (Chats Resolved on First Contact / Total Resolved Chats) * 100
Example:
If your team resolves 380 out of 500 chats in a single session without follow-up, your FCR is (380 / 500) * 100 = 76%.
What to do when FCR is low:
Audit recurring conversation tags. Low FCR often points to insufficient agent permissions (e.g., having to escalate every basic billing adjustment), missing internal knowledge base articles, or inadequate pre-chat qualification routing.
4. Average Resolution Time (ART)
Average Resolution Time measures the total time required to fully close a customer’s issue, from the moment the conversation begins to final resolution.
It is important to distinguish between active handling time (the minutes an agent actually spends troubleshooting) and total elapsed time (which includes pauses where the customer steps away from their keyboard).
Formula:
Average Resolution Time = Total Resolution Duration for All Chats / Total Number of Resolved Chats
Example:
If 100 chats take a combined total of 800 minutes from start to finish, the ART is 8 minutes per conversation.
What to do when Resolution Time is elevated:
Break down resolution times by conversation category. If straightforward password resets take 12 minutes, your self-service workflows need attention. If complex technical integrations take 25 minutes, that may reflect appropriate care rather than an operational failure.
5. Customer Satisfaction Score (CSAT)
Customer Satisfaction Score measures customer sentiment immediately following a completed live chat conversation.
Typically captured via a post-chat survey prompt (e.g., “How would you rate the support you received today?” using a 1–5 star scale or thumbs up/thumbs down), CSAT provides direct feedback on the customer’s perceived experience.
Formula:
CSAT (%) = (Total Positive Ratings [4s and 5s] / Total Survey Responses) * 100
Example:
If 240 out of 300 completed post-chat surveys are rated 4 or 5 stars, your CSAT score is (240 / 300) * 100 = 80%.
| CSAT Rating Band | Performance Assessment | Primary Action Required |
|---|---|---|
| 85% – 100% | Excellent | Maintain best practices; reward top performers |
| 70% – 84% | Average / Acceptable | Review recurring negative feedback themes |
| Below 70% | Underperforming | Audit agent training, resolution speed, and routing accuracy |
What to do when CSAT dips:
Never analyze CSAT in a vacuum. Cross-reference low satisfaction scores with First Response Time, transfer counts, and specific issue categories to determine whether poor ratings stem from agent behavior, long wait times, or restrictive company policies.
6. Chat Abandonment Rate
Chat Abandonment Rate measures the percentage of visitors who initiate a chat but disconnect before an agent answers or before their issue is addressed.
When a customer clicks your chat bubble, their intent is peaked. If they are forced to wait in an unmanaged queue, frustration sets in quickly. High abandonment represents lost sales opportunities and higher customer churn risk.
Formula:
Abandonment Rate (%) = (Total Abandoned Chats / Total Incoming Chat Requests) * 100
Example:
If 85 out of 1,000 visitors who requested a chat leave before an agent connects, your abandonment rate is 8.5%.
What to do when Abandonment is high:
Analyze when abandonment occurs. If drop-offs surge after 90 seconds of queue time, set up automated instant queue messaging, integrate an AI chatbot to engage users immediately, or implement proactive routing during high-traffic shifts.
7. Chat Volume
Chat Volume is the raw count of incoming conversations received over a defined period (hourly, daily, weekly, or monthly).
While total volume doesn’t inherently indicate good or bad service, it provides the essential context required to interpret every other metric. Segmenting volume by time of day, customer tier, landing page, and issue category turns raw numbers into workforce planning intelligence.
What to do with Chat Volume trends:
Use historical volume distributions to eliminate understaffed shifts. If 45% of conversations occur between 1:00 PM and 4:00 PM, adjust shift schedules to maximize agent availability during that specific window.
8. Missed Chat Rate
A Missed Chat occurs when a customer requests a conversation during advertised operational hours, but no agent accepts the chat before the session times out.
Unlike abandonment (where a customer chooses to leave), a missed chat represents a failure of internal availability or notification systems. It is one of the quickest ways to erode brand trust.
Formula:
Missed Chat Rate (%) = (Total Unanswered / Missed Chats / Total Inbound Chats During Operating Hours) * 100
Example:
If 25 chats go completely unanswered out of 500 inbound requests during business hours, the Missed Chat Rate is 5%.
What to do when Missed Chats occur:
Audit agent status alerts, ensure automatic failover routing transfers unanswered chats to backup agents after 30 seconds, and convert unassigned offline chats directly into tracked support tickets.
9. Average Chat Duration
Average Chat Duration measures the elapsed time from when an agent accepts a chat to when the session is closed.
A longer duration is not inherently negative. In technical troubleshooting or enterprise SaaS onboarding, thorough interactions often yield higher satisfaction and lower repeat contact rates. Conversely, basic transactional inquiries (e.g., checking shipping status) should remain brief.
Formula:
Average Chat Duration = Total Active Conversation Time / Total Completed Chats
What to do with Duration metrics:
Evaluate duration by intent category rather than treating one universal number as a benchmark. If simple policy questions average 14 minutes, review agent typing speed, canned response usage, and knowledge base clarity.
10. Chats per Agent (Concurrent & Total Load)
This operational metric tracks both the total volume of chats handled by an individual agent over a shift and their concurrent chat concurrency (number of chats handled at the same time).
Unlike voice support, live chat allows reps to multitask. However, overloading agents degrades response speed and empathy.
Formula:
Chats per Agent = Total Closed Chats in Period / Total Active Agents on Shift
| Concurrency Level | Typical Use Case | Quality Risk |
|---|---|---|
| 1 – 2 Chats | Complex technical troubleshooting, VIP accounts | Low risk; high focus |
| 2 – 3 Chats | Standard mixed SaaS/e-commerce inquiries | Optimal balance for most teams |
| 4+ Chats | Basic transactional FAQs only | High risk of delayed replies and agent burnout |
What to do with Agent Load data:
Never rank agents by raw chat volume alone. An agent who closes 75 simple FAQ chats may produce less business value than an agent who spends 40 minutes resolving a complex renewal blocker for an enterprise account. Always evaluate volume alongside CSAT and FCR.
11. Chat-to-Conversion Rate
For revenue-focused teams, the Chat-to-Conversion Rate tracks how many live chat interactions lead directly to a commercial milestone—such as a completed sale, demo booking, trial signup, or qualified lead submission.
Website visitors who engage via live chat often convert at significantly higher rates than passive page visitors because real-time answers eliminate last-minute purchase hesitation.
Formula:
Chat Conversion Rate (%) = (Total Conversions Attributed to Chat Users / Total Qualified Commercial Chats) * 100
Example:
If your sales chat team conducts 400 conversations on high-intent pricing pages and generates 48 booked software demos, your conversion rate is (48 / 400) * 100 = 12%.
What to do to increase Conversions:
Deploy proactive chat invitations on high-friction pages (e.g., checkout funnels or pricing tiers) when a user pauses for more than 45 seconds, offering immediate assistance before they bounce.
12. AI Deflection & Automation Resolution Rate
As modern support architectures adopt conversational AI, tracking automated containment and deflection has become standard practice.
AI Deflection Rate measures the percentage of total customer inquiries successfully handled and resolved by an AI agent without requiring human intervention.
Formula:
AI Deflection Rate (%) = (Total Inquiries Resolved Entirely by AI / Total Inquiries Handled by AI) * 100
Example:
If your AI assistant handles 1,200 routine tier-1 inquiries (e.g., order lookups, password resets, basic FAQs) and resolves 840 without human intervention, your deflection rate is 70%.
The Quality Rule for AI:
A high deflection rate is only positive if the customer’s problem was genuinely solved. A bot that forces a session to close while the customer remains stuck is a failure, not a deflection. Always monitor AI CSAT and Repeat Contact Rates alongside raw deflection.
Which Live Chat Metrics Should You Prioritize?
Attempting to track 30 different metrics simultaneously creates dashboard fatigue. The most effective approach is to map specific metrics to your primary business objectives:
| Business Objective | Primary Metrics to Monitor | Supporting Indicators |
|---|---|---|
| Accelerate Support Speed | First Response Time (FRT), Average Response Time | Queue Waiting Time, Missed Chat Rate |
| Elevate Resolution Quality | First Contact Resolution (FCR), Average Resolution Time | Repeat Contact Rate, Transfer Rate |
| Improve Customer Experience | CSAT, Customer Effort Score (CES) | Abandonment Rate, Escalation Rate |
| Optimize Staffing & Capacity | Chat Volume by Hour, Agent Concurrency | Agent Utilization, Missed Chats |
| Drive Business Revenue | Chat-to-Conversion Rate, Leads Generated | Pipeline Influenced, Value per Chat |
| Scale Support Efficiently | AI Deflection Rate, Bot-to-Human Handoff Rate | AI CSAT, Containment Rate |
The Core 5 Starter Framework
If you are building your live chat analytics dashboard from scratch, start with these five core metrics:
- First Response Time (FRT): Protects the initial customer experience.
- First Contact Resolution (FCR): Measures operational effectiveness.
- Customer Satisfaction Score (CSAT): Captures customer sentiment.
- Chat Abandonment Rate: Identifies queue and staffing friction.
- Chat Volume: Provides context for all capacity and scheduling decisions.
Once your baseline is established, layer in commercial conversion and AI deflection metrics.
How to Use Live Chat Analytics to Improve Support Operations?
Scenario 1: First Response Time Is Increasing
If first response time rises from 40 seconds to more than 2.5 minutes during weekday afternoons, the issue may not be slow agents. Analytics may show that agents are reaching their maximum chat capacity while website traffic is at its peak. In this case, you can use automated bots to collect basic information before an agent joins the conversation and adjust staffing schedules to put more agents online during these high-volume periods.
Teams can also review Live Chat Best Practices to find other ways to reduce waiting time and improve the customer experience.
Scenario 2: CSAT Scores Are Declining
A drop in CSAT below 72% on particular shifts can point to problems in how conversations are being routed. For example, if analytics show that customers are frequently transferred between three agents before getting an answer, the problem is likely poor initial routing rather than agent performance. Routing rules can be refined around customer intent and issue type so technical questions go directly to the right specialists.
Scenario 3: First Contact Resolution Is Low
When repeat contacts within 48 hours rise to 28%, it may indicate that agents are closing conversations before the customer’s issue is fully resolved. This can happen when agents are under pressure to maintain low average handle times. Instead of treating speed as the primary measure of performance, support teams can give agents more time to resolve complex issues, improve internal documentation for common edge cases, and provide direct access to the tools they need to fix account-related problems during the first conversation.
Scenario 4: Abandonment Rate Spikes on High-Value Pages
If chat abandonment reaches 18% on a pricing page, analytics can help identify whether customers are leaving because they are waiting too long for a sales representative. For example, if wait times regularly exceed two minutes while sales reps are occupied with demos, the chat experience needs a fallback option. You can automatically offer visitors the option to book a meeting or leave a message when no representative is immediately available, giving high-intent prospects another way to continue the conversation.
How Often Should You Review Live Chat Metrics?
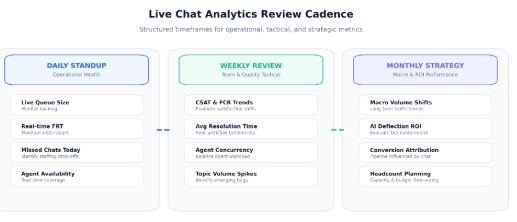
What Should a Modern Live Chat Analytics Dashboard Include?
To run an efficient support department without toggling between multiple disconnected spreadsheets, your reporting environment should centralize five key pillars:
- Support Performance: Total conversations, active chats, first response time, average response time, resolution time.
- Customer Experience: CSAT, Customer Effort Score, abandonment rate, missed chats.
- Agent Performance: Chats per agent, concurrency load, resolution rate, CSAT by agent.
- Business Performance: Leads generated, conversions, pipeline influenced by chat.
- AI Performance: AI-handled conversations, AI resolution rate, bot-to-human handoff rate, AI CSAT.
A complete solution like SupportSuite247 brings real-time visitor tracking, ticketing, live chat metrics, and conversational AI into a single workspace. You can also view our Pricing to compare the available plans and features.